See how SAP links supplier commitments, production, inventory, transport events, and customer orders to support faster, better-informed supply chain decisions.
Most supply chains already generate large volumes of data. The harder problem involves connecting each event to the orders, materials, plants, shipments, and customer commitments it affects.
A carrier may report a delay while the purchase order still carries the original delivery date. The plant continues to expect the component, the warehouse keeps the dock appointment, and customer service preserves a promise that the company can no longer meet. Each team holds valid information. No one sees the complete operational effect soon enough to coordinate a response.
Recent maritime bottlenecks illustrate how a single delayed vessel forces adjustments across the entire supply chain. UN Trade and Development reported that by May 2025, tonnage through the Suez Canal remained 70% below 2023 levels as shipping companies continued bypassing the Red Sea. Extended transit times on ocean freight force direct changes to warehouse receiving windows, factory production sequencing, dock worker shifts, and total freight expenses long before a container actually arrives at the port.
SAP links these overlapping operational variables using connected ERP systems, planning modules, partner collaboration portals, manufacturing execution, and warehouse management. The platform incorporates transportation routing, active freight tracking, embedded analytics, and artificial intelligence to process the incoming data. With the required SAP integrations and business rules in place, relevant events can flow into downstream processes, giving affected teams the information they need to review plans and respond. The resulting visibility depends on how reliably those applications exchange business objects and operational events.
What End-to-End Supply Chain Visibility Covers
End-to-end supply chain visibility gives planning and operations teams a current view of materials, orders, capacity, inventory, production, shipments, and customer commitments across internal operations and external partners. This monitoring spans both internal company facilities and third-party vendor networks. The technical scope tracks everything from initial supplier confirmations and factory floor assembly to warehouse staging and the final customer drop-off.
Connected visibility gives planners and operators the status and business context they need to investigate exceptions and coordinate a response. Dispatchers and planners look for specific details to keep operations moving. They need to locate current shipments, identify immediate risks to production schedules, calculate remaining transit buffers, find available backup routes, and determine exactly who owns the next required action.
Determining the right refresh rate for system data depends heavily on the specific workflow. A time-sensitive dock appointment may require frequent location or ETA updates. Conversely, procurement teams mapping out factory capacity for the upcoming quarter usually only need weekly reports. Paying for continuous data streaming wastes IT budgets if managers only check those specific metrics every thirty days. Software architects configure these refresh intervals to match the actual window teams have to resolve an active issue.
Supply chain transparency tackles a different set of requirements compared to daily operational tracking. Operational visibility covers current status, expected changes, and active exceptions across supply, production, inventory, warehousing, transportation, and fulfillment. Transparency digs deeper into vendor sourcing tiers, exact raw material origins, manufacturing batch history, and environmental compliance records. Many support both requirements within the same system landscape. Supply chain transparency often relies on additional supplier-tier, origin, batch, sustainability, and traceability data, as well as data models and access controls that may differ from those used for day-to-day operational visibility.
Why Supply Chain Visibility Matters Today
Disruptions affect several plans at once
A delayed vessel changes more than a transportation schedule. The delay may reduce component coverage at a plant, push production into another shift, leave a warehouse team waiting for freight, trigger premium shipping, and place customer orders at risk. Companies often discover the problem in stages: logistics sees the vessel update first, production learns about the shortage later, and customer service reacts after the promised date has already slipped.
When alerts reach the responsible team with the required business context, connected visibility can shorten the interval between the first signal and the business response by showing which orders, materials, plants, and customers depend on the delayed movement. Planning and operations teams can then distinguish a local delay from an event that threatens several sites or customer commitments.
External partners hold critical data
ERP records show purchase orders, requested dates, and planned receipts. Suppliers hold the latest production and capacity information. Carriers and freight forwarders hold actual movement events and revised arrival estimates. Contract manufacturers may manage work in progress through their own systems.
SAP Business Network Supply Chain Collaboration supports digital exchange of forecasts, order confirmations, inventory data, manufacturing updates, quality information, and shipment notices with trading partners. SAP Business Network Global Track and Trace adds order and shipment events from carriers, logistics providers, and visibility data sources.
LAPP provides a recent example. The manufacturer connected suppliers and freight forwarders through SAP Business Network, created freight orders in SAP Transportation Management, and used SAP Business Network Global Track and Trace for inbound shipment events. LAPP reports that more than 90% of purchase orders are now confirmed automatically. The company also reports productivity gains of more than 30% for buyers and 10% time savings for customer service and logistics teams from an SAP Business Technology Platform (SAP BTP) application. Those results reflect LAPP's scope and baseline. Another company should build its own case from current process times, labor effort, inventory exposure, and logistics costs.
Inventory decisions depend on signal quality
Safety stock often compensates for uncertainty in supplier performance, transit time, forecast accuracy, and production output. Earlier, more reliable signals can reduce that uncertainty. Incomplete or late signals can distort inventory recommendations or understate the actual supply risk.
SAP Integrated Business Planning for Supply Chain (SAP IBP) combines demand, supply, response, replenishment, and inventory planning with alerts, simulations, and supply chain analytics. Planners can test how a shortage, demand increase, or capacity constraint changes projected inventory and customer coverage before they adjust the plan.
Customer commitments require shared context
A standard carrier tracking website usually just displays the most recent scan location. That isolated update rarely tells a sales representative if specific components will miss a deadline, if backup inventory sits in a nearby facility, or if shipping a partial load might keep a buyer's assembly line running.
Linking ERP, warehouse, planning, and transportation data allows customer service and warehouse teams to work from consistent operational information while using role-specific applications and views. SAP Cloud ERP handles live stock counts, delivery commitments, active picking tasks, and freight routing across the entire fulfillment cycle.
Where Visibility Commonly Breaks Down
Teams work from different versions of the same event
Procurement may record a supplier confirmation, production planning may track a shortage in a spreadsheet, logistics may rely on a carrier portal, and customer service may rely on the confirmed delivery date in the sales order. Each record follows its own update cycle, so reconciliation starts after the exception has already consumed the available response time.
Departmental ownership creates another problem. Procurement owns the supplier relationship, logistics owns freight, manufacturing owns the production schedule, and sales owns the customer promise. A disruption crosses those boundaries, so every exception needs an unambiguous responsible role and a defined path for validation, escalation, and approval.
Partner data arrives late or lacks common identifiers
Suppliers and logistics providers send updates through EDI messages, APIs, portals, spreadsheets, emails, and phone calls. Event names, timestamps, locations, and reference numbers often differ. Different carriers may use different status vocabularies and levels of granularity for related shipment events.
The mismatch becomes harder to resolve across several ERP systems or acquired businesses. Material numbers, supplier IDs, location codes, delivery numbers, and shipment references may vary by source. Teams cannot use a carrier event to update the correct production or customer plan until the receiving system matches it to the relevant business objects.
Dashboards expose problems without directing action
Companies evaluating supply chain visibility software often compare dashboards and data feeds first. Many already track inventory, late deliveries, supplier performance, and freight status. Periodic reports may explain past performance while offering limited support for the exception requiring action now.
Supply chain monitoring needs impact rules, priority logic, ownership, response options, and resolution tracking. Static thresholds can generate more alerts than a team can review, so prioritization should account for material criticality, customer priority, days of supply, remaining response time, revenue exposure, and available alternatives.
How SAP Connects Supply Chain Data and Decisions
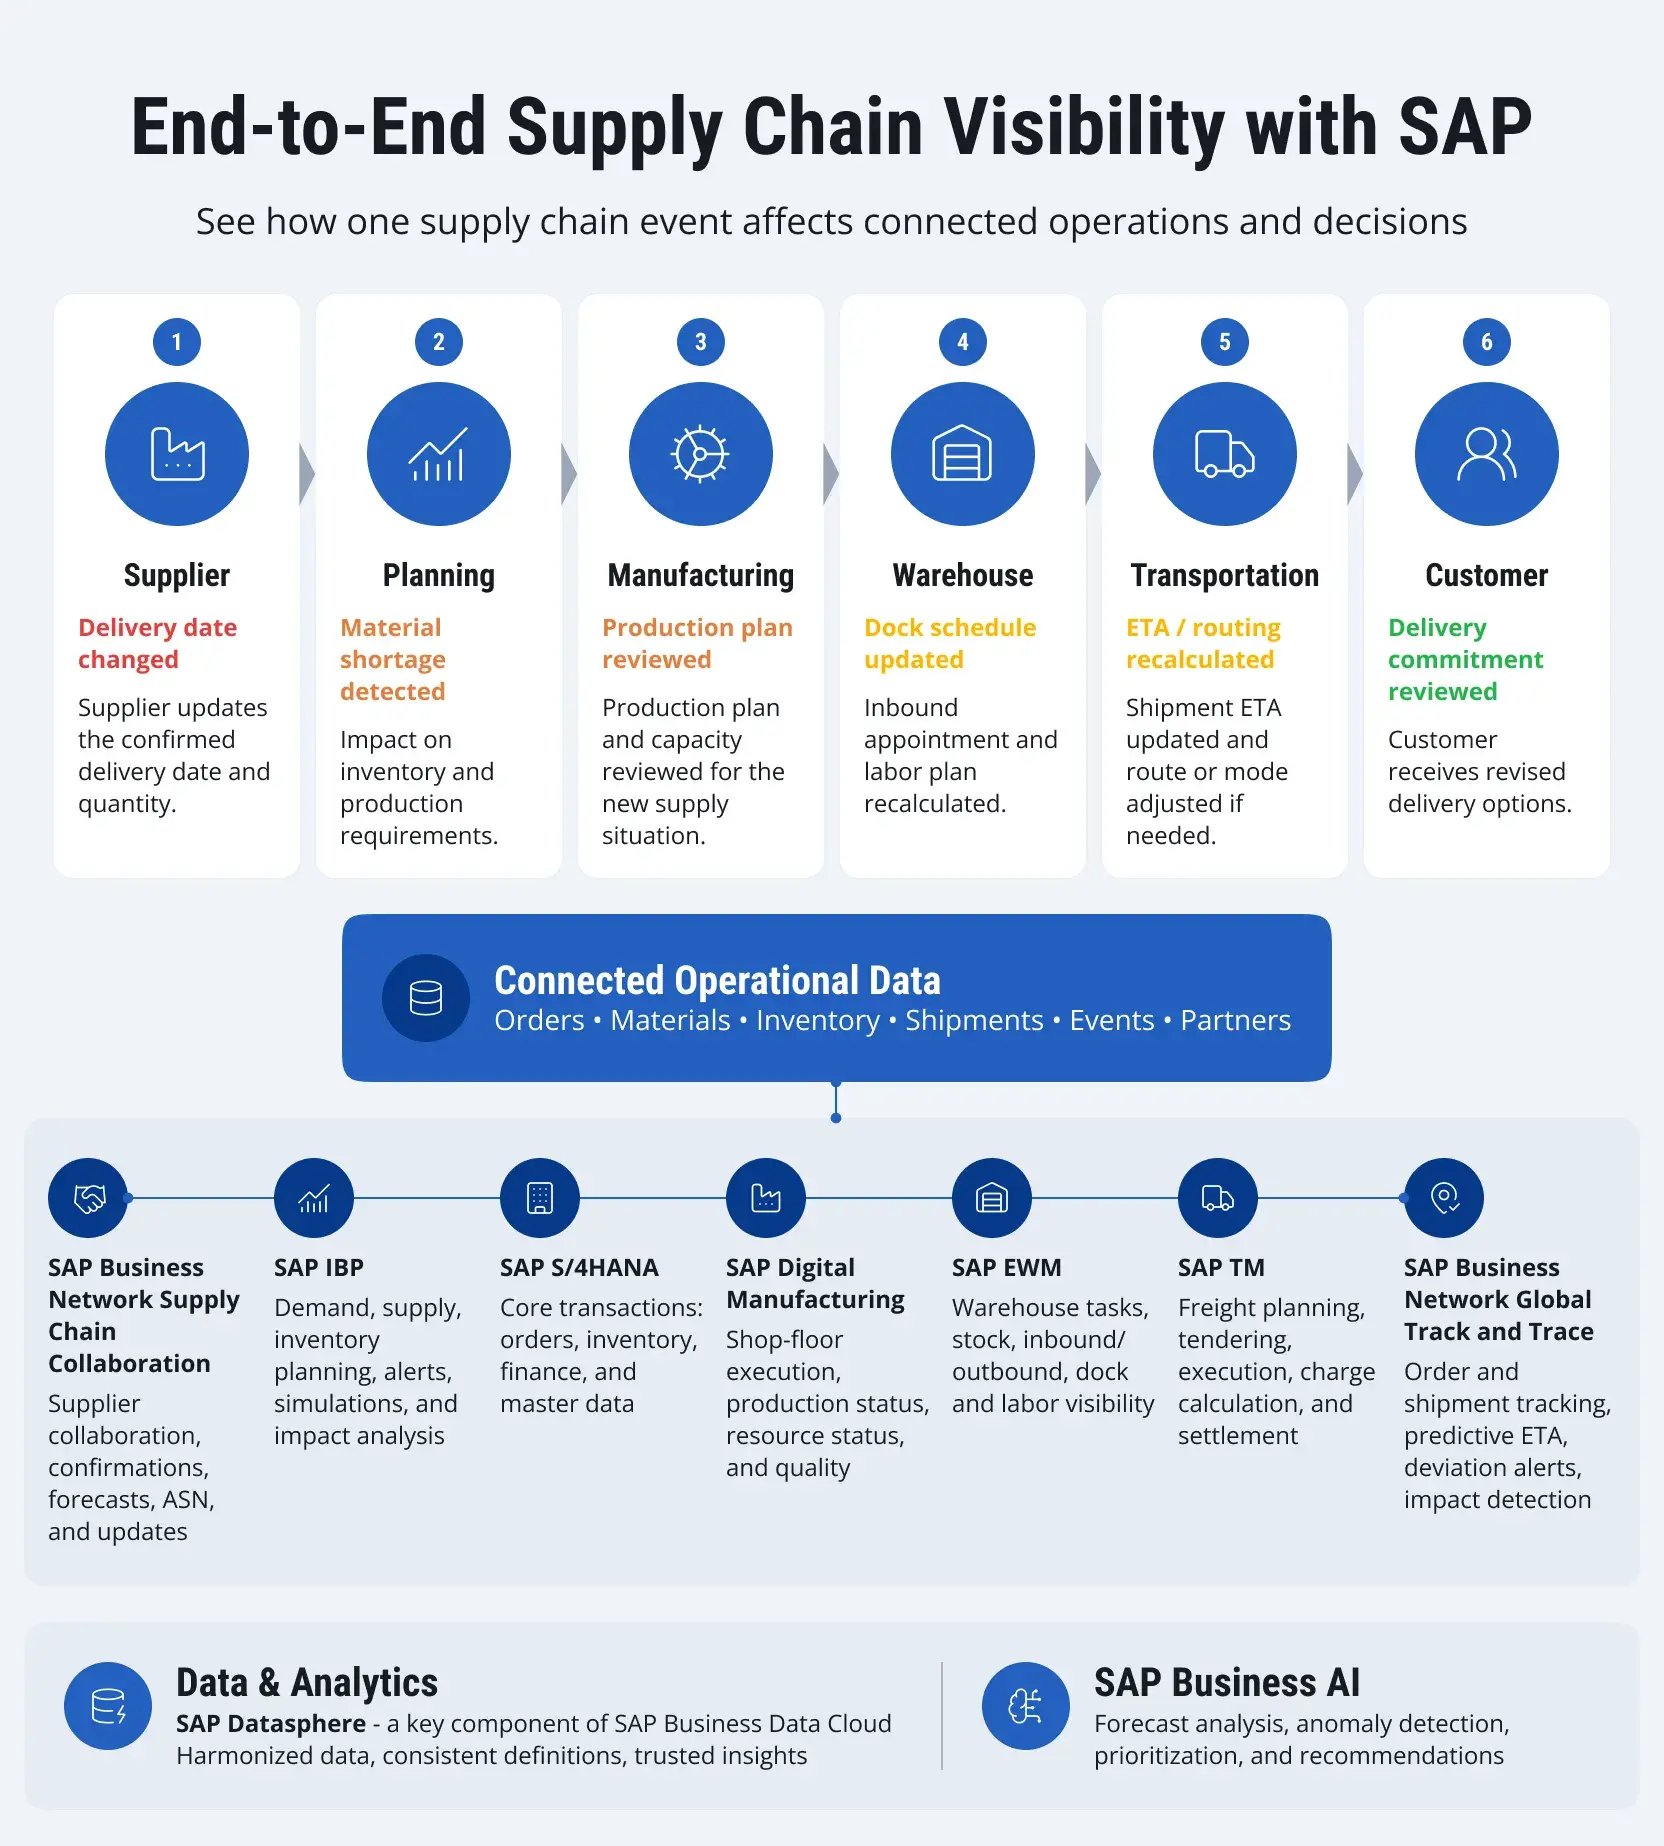
Across SAP supply chain management applications, different products handle planning, execution, collaboration, tracking, integration, and analytics because each area requires different data and processing rules. A supplier delay becomes actionable when the purchase order, projected stock, production requirement, freight movement, and customer order share reliable references.
Core transactions and forward-looking plans
Depending on the deployment model, SAP Cloud ERP, SAP Cloud ERP Private, or SAP S/4HANA on-premises can provide purchase orders, production orders, inventory movements, sales orders, deliveries, material data, locations, and financial context. The available integration scope and standard content vary by ERP deployment and the surrounding system landscape. These records connect an operational event with its commercial and fulfillment consequences.
SAP IBP adds demand, supply, capacity, inventory, response, and scenario data. Its end-to-end visibility capabilities support network views, exception detection, impact analysis, and action from the same planning environment. A planner can compare the current plan with a revised supplier commitment or production constraint and evaluate response options before changing execution.
Partner collaboration and physical execution
SAP Business Network extends selected processes to suppliers, contract manufacturers, carriers, and logistics providers. Companies can exchange forecasts, commitments, inventory positions, manufacturing updates, purchase-order messages, quality information, freight documents, and shipment events through structured processes.
Execution applications contribute to the physical status of work and goods. SAP Digital Manufacturing supplies plant-level production events, resource status, quality information, and near-real-time operational analytics. SAP Extended Warehouse Management (SAP EWM) provides stock, task, resource, inbound, outbound, and warehouse process visibility. SAP Transportation Management (SAP TM) covers freight demand, planning, tendering, execution, settlement, and transportation monitoring.
SAP Business Network Global Track and Trace enriches logistics processes with carrier and visibility-provider events, estimated arrival times, deviation alerts, and links to order-fulfillment processes. That connection allows a shipment delay to reach production or customer service with the relevant order context attached. The exact integration pattern and available standard content depend on the ERP edition and the surrounding system landscape.
Integration, shared definitions, and analytics
Many global organizations operate mixed SAP and third-party application landscapes. SAP Integration Suite connects SAP and third-party applications, data, APIs, events, and B2B processes across cloud, on-premises, and hybrid environments.
SAP Datasphere, within SAP Business Data Cloud, can connect and harmonize SAP and third-party data while preserving shared business definitions. That role becomes useful when several systems calculate inventory, service level, lead time, supplier performance, or shipment status differently.
SAP Business AI capabilities can use this operational context for forecasting, anomaly detection, prioritization, explanations, and planning recommendations. Those capabilities depend on complete events, consistent identifiers, and monitored model performance. A prediction cannot compensate for a supplier that never reports a delay or for a shipment linked to the wrong delivery.
Connected Visibility Across the Supply Chain
Consider a hypothetical US industrial-equipment manufacturer sourcing an electronic component from Southeast Asia. The component supports several finished products, and two customer orders depend on fixed maintenance windows.
Supplier and procurement visibility
The supplier revises its confirmed quantity and delivery date through SAP Business Network. In an integrated landscape, procurement can evaluate the revised commitment alongside the purchase order, sourcing data, contractual terms, and open requirements. Configured business rules can flag the deviation when the new date exceeds the agreed tolerance or when the quantity falls below the confirmed amount.
The response then depends on material coverage and production demand. A three-day delay may have little effect when the plant holds two weeks of stock; the same delay can stop production when available inventory covers one shift. The visibility process must connect the supplier event with projected stock and demand before assigning severity.
Planning and manufacturing visibility
SAP IBP evaluates the revised supply against demand, inventory, capacity, and production requirements. Planners can compare options such as reallocating stock, moving production to another plant, changing the sequence, using an approved substitute, or expediting a partial quantity.
SAP S/4HANA supplies the production order and material context. SAP Digital Manufacturing adds the current shop-floor position. A schedule change may look feasible in a planning model while the plant has already staged components, started a batch, or committed a constrained resource. Production events help the planner judge whether the proposed change can still occur without avoidable scrap, idle time, or quality risk.
Warehouse and transportation visibility
SAP EWM shows available stock, inbound deliveries, staging progress, warehouse tasks, labor demand, and dock activity. If the revised shipment misses its appointment, the warehouse can reassign the door and labor to another inbound load. If another site holds substitute stock, the company can evaluate the transfer together with warehouse capacity and handling time.
SAP TM supports the revised freight plan, carrier selection, tendering, execution, and cost calculation. SAP Business Network Freight Collaboration can carry the request and follow-up messages to the logistics provider through connected tendering and freight-order processes.
SAP Business Network Global Track and Trace can then receive movement events and update the estimated arrival time as the shipment progresses. SAP TM also integrates with SAP EWM for relevant inbound and outbound warehouse activities and status synchronization.
Customer delivery visibility
The revised supply and production outlook changes the expected completion date for both customer orders. Customer service can review the affected order lines, current inventory, allocation rules, planned shipments, and delivery alternatives before contacting either customer.
Available stock may be allocated to one order because the customer's maintenance shutdown leaves little room for delay. The second may move to a later production slot with an agreed partial delivery. Shared operational data gives sales, planning, manufacturing, and logistics a basis for that decision and records the consequences in the systems that execute it.
AI, Analytics, and Predictive Signals
AI can reduce planner effort when it helps prioritize exceptions that may affect supply, cost, or customer service. SAP IBP uses statistical methods, machine learning, demand sensing, outlier correction, alerts, and simulations across supply chain planning. These capabilities can identify demand changes, projected shortages, inventory imbalances, and capacity pressure earlier than a periodic manual review.
Transportation data supports another use case. SAP Business Network Global Track and Trace can combine carrier or visibility-provider events with business rules and predictive arrival information. Teams can receive an alert when a delayed shipment threatens production or customer delivery, then evaluate the affected orders through the connected process context.
SAP also provides AI-supported planning assistants and recommendations for demand, supply, inventory, capacity, and exception analysis. These tools can assemble relevant data and propose actions. Companies should retain human approval for high-value allocation changes, quality-sensitive production changes, regulatory decisions, and customer-priority choices.
Data quality, model performance, control thresholds, and governance all affect whether users can rely on the output. Teams need thresholds for acceptable forecast error, checks for missing or stale inputs, records of accepted and rejected recommendations, and periodic reviews for drift. An alert that users repeatedly dismiss may point to weak data, inappropriate thresholds, poor routing, excessive alert volume, or limited business value.
Business Benefits and the KPIs That Show Them
Earlier detection can reduce premium freight, missed sales, excess inventory, and manual follow-up. The measurement plan should connect each expected outcome with the process change that produces it.
|
Expected outcome |
Operational change |
KPIs |
|
Faster disruption response |
Events reach the affected orders, plants, shipments, and owners sooner. |
Time to detect, time to assess, time to assign, time to resolve, exception age |
|
Shorter recovery after disruption |
Teams identify affected flows and compare feasible alternatives before service fails. |
On-time, in-full (OTIF) during disruption, fill rate for critical orders, backlog growth during disruption, percentage of priority orders fulfilled |
|
More reliable inventory planning |
Supplier, demand, production, and arrival signals update the projected stock. |
Inventory projection error, days of supply, stockout rate, excess and obsolete inventory, safety-stock attainment |
|
Lower logistics cost |
Teams plan capacity earlier and reduce avoidable expedites, detention, and low-utilization moves. |
Premium freight share, cost per shipment, detention cost, load utilization, tender acceptance |
|
More accurate customer commitments |
Sales and service use current supply, production, and transport data. |
On-time in full, promise-date accuracy, perfect-order rate, order-cycle time |
|
More reliable supplier commitments |
Structured confirmations and exceptions replace manual follow-up. |
Confirmation cycle time, confirmation adherence, commit-to-actual variance, ASN timeliness, percentage of confirmations within tolerance |
|
Fewer late planning changes |
Planners evaluate shortages and demand changes before execution absorbs the impact. |
Rescheduling frequency, changes inside the frozen horizon, schedule stability, production plan adherence |
|
Higher event and matching quality |
Teams monitor source coverage, event freshness, and identifier matching. |
Event completeness, match rate, update latency, partner coverage, and failed-message rate |
A company should record baseline values before implementation. Post-go-live improvements can otherwise reflect seasonality, a product-mix change, lower demand, or another project. Customer examples such as LAPP show possible outcomes, while a credible business case still requires the company's own volumes, labor rates, inventory carrying costs, freight spend, and service penalties.
What a Successful Visibility Program Requires
Start with one decision that carries a measurable cost
A useful first scope may cover inbound delays for a constrained component, temperature-sensitive deliveries, supplier confirmations for a high-volume material group, or finished-goods shipments for a strategic customer segment. The team should document the current detection delay, manual effort, service impact, inventory exposure, and freight cost. This focus keeps design discussions tied to a decision. It also limits the first set of interfaces, partners, events, and users, which makes data problems easier to find.
Define events before building dashboards
Each event needs a business meaning, source, timestamp, location, status, reference object, expected frequency, and owner. Teams should also define missing-event rules because silence from a supplier after a confirmation deadline may carry more risk than an explicit late date.
The event model should separate observed facts from predictions. A carrier departure scan records an event, while an estimated arrival time records a calculation. Users need both, along with the source and update time.
Resolve identifiers and data ownership early
Materials, locations, suppliers, customers, orders, deliveries, shipments, batches, and handling units need consistent mappings across systems. Several source identifiers can remain in place when the integration layer maintains governed mappings among them.
Data ownership can follow the source process. Procurement may own supplier master data, logistics may own carrier-event definitions, manufacturing may own production milestones, and a central data team may own cross-system mappings. Each data owner needs to define correction and approval procedures.
Connect alerts with response rules
An alert should tell the assigned user which object faces risk, why the system assigned the priority, how much time remains, and which actions the process allows. The workflow should also capture acceptance, reassignment, escalation, decision, and resolution.
Teams should track false positives, repeated dismissals, late acknowledgments, and unresolved exceptions. Those measures reveal whether the problem comes from source data, threshold design, unclear responsibility, or insufficient capacity.
Expand after the first flow produces stable results
The first release should measure event coverage, data freshness, match accuracy, alert precision, user adoption, and business impact. Expansion can then add regions, plants, product groups, partners, and exception types while preserving the tested definitions.
An early rollout across many sites can create duplicate data, noisy alerts, and unclear ownership before the team has corrected the first design. A phased rollout keeps the affected scope manageable during those corrections.
Our Expertise in Connected Supply Chain Projects
With over two decades in the ERP domain, LeverX helps organizations design, implement, integrate, and optimize SAP Digital Supply Chain solutions. Depending on the project scope, the landscape may include SAP Business Network, SAP IBP, SAP TM, SAP EWM, SAP Digital Manufacturing, SAP S/4HANA, SAP Cloud ERP, and SAP Integration Suite. The work can also cover connections with analytics platforms, partner systems, and other third-party applications.
Our expertise shows that projects can begin with a process and architecture assessment covering decision delays, manual handoffs, source systems, partner dependencies, event gaps, data quality, and measurable business exposure. These audit results dictate the initial project boundaries. IT groups rely on the gathered data to decide if the first software deployment should target a single physical delivery route or encompass broader operations spanning demand forecasting, warehouse logistics, shop floor assembly, and external vendor portals.
Implementation can cover solution architecture, application configuration, master and transactional data preparation, interface design, and integration-flow setup. Teams can configure integrations through standard APIs and prebuilt integration content where appropriate, onboard external partners, set up alerts, run functional and performance tests, establish monitoring, and provide post-go-live support.
When an organization requires active data feeds from separate external tools, our developers deploy the SAP Integration Suite to link the central SAP environment directly with those outside applications. For SAP S/4HANA and SAP Cloud ERP programs, LeverX teams can also favor standard integration and extension patterns that limit unnecessary custom code and support clean-core objectives.
Conclusion
Operations personnel rely on continuous supply chain tracking to monitor exact vendor delivery schedules, daily factory yields, precise physical stock counts, active dock tasks, outbound freight, and pending buyer requests. SAP handles this massive data integration. The platform extracts specific records directly from the central enterprise database, dedicated execution modules, and external vendor portals before running that raw information through built-in analytics and machine learning algorithms.
Business value grows when incoming data gives teams enough time to assess the operational impact and adjust their plans. A missed supplier delivery, for example, can change the material availability outlook and lead planners to review production schedules, transportation options, and customer delivery commitments. Targeting a single expensive logistics route allows project teams to benchmark exact system reaction times, baseline operating expenses, and delivery accuracy. Managers can use those hard metrics to justify rolling out the software to additional manufacturing sites, global regions, and outside vendors.